
Article 2 of the “NAOI Future of Investing” Series: As Posted at Nasdaq.com
Setting a Higher Portfolio Performance Benchmark
using Dynamic Investments
By Leland B. Hevner
President, National Association of Online Investors (NAOI)

naoi president, leland hevner
Individual investors today have very low expectations when it comes to the performance of their investment portfolios. We have been taught that an average return of 6% per year is good while anything over 8% is seen as a major investing success.
Yet, the market offers significantly higher returns than these, without additional risk, at all times and in any economic condition. The problem is that investors can’t capture them because virtually the entire financial industry tells us that we must own portfolios designed based on Modern Portfolio Theory (MPT), an approach introduced over six decades ago - in 1952. MPT dictates that portfolios be created to match each investor’s risk profile, not to take full advantage of market returns potential. And, as investors, we don’t complain our low performance portfolios because we are not aware of what we are missing.
This is about to change with the development by the NAOI of Dynamic Investment Theory (DIT) and the Dynamic Investments (DIs) it creates. DIT and DIs are described in Article 1 of this series.
This article explains how DIs enable us to escape the MPT box and give us much higher expectations for our portfolio returns by comparing them to a simple Dynamic Investment Performance Benchmark.
DI Components and Management in Review
Before beginning a discussion of DI performance, let’s review the DI design components and management process. More detailed information is found at the link presented just above.
The DI design components include a Dynamic Equity Pool (DEP) where the designer places ETFs (or mutual funds) that track indexes for areas of the market where DIs will look for uptrending equities. At periodic Review Periods (e.g. Quarterly) the DI uses a Trend Indicator to rank the ETFs in the DEP to determine which is moving up most strongly in price. This is the one ETF that is purchased, or retained if already owned, and held until the next Review event when the DEP ranking process is repeated. As an option, a designer can also place a Trailing Stop Loss Order on the ETF held to protect the DI from sudden price drops.
This process is simple and decisions are based on objective observations of market data, not on human judgments. As a result, DIs can easily be managed by individuals using an online broker. Or the process can be completely automated by a financial firm.
Do Dynamic Investments work? Let’s take a look at a simple example.
Dynamic Investment Performance – An Example
There are an unlimited number of DIs that can be created by a designer for virtually any investing goal. To illustrate the level of performance they can produce, I will use a very simple DI with these design variables:
The Dynamic Equity Pool (DEP). The DEP will hold these ETFs:
EDV: Vanguard Extended Duration Treasury Bonds (25+yr)
SPY: SPDR S&P 500 Stock Index (LargeCap Value Stocks)
RZG: Invesco S&P SmallCap 600 Pure Growth Stocks
This DEP contains ETFs that tracks both the Stock and Bond asset classes with two “types” in the Stock asset class.
The Review Period – The DI will be reviewed Quarterly
The Trend Indicator – I will use a very simple trend indicator to rank the ETFs in the DEP to find the one that is trending up in price most strongly at each Review event. Multiple trend indicators exist. The one most frequently used by the NAOI is discussed in our publications and training courses.
The Trailing Stop Loss – This is an optional design element discussed at length in NAOI publications and courses that protects the DI from significant price drops during the short period it is held between Reviews. For simplicity sake, I will not use a Stop-Loss order in this example.
Defining Performance
The world of investing has many definitions of “performance”. In this example, I will use the following two factors to define performance.
Compound Annual Growth Rate – This is the percentage annual increase in value of an investment being tested assuming all gains are reinvested.
Sharpe Ratio – This is an indicator that shows the amount of return received for each unit of risk taken and the higher the better. Any value over 1.0 is seen as superior performance.
A DI Performance Example for the Years 2008-2017
The table below shows the backtested performance from the start of 2008 to the end of 2017 of our example DI compared to the performance of an MPT portfolio holding the same ETFs with a 60% allocation to Stocks (equally divided between SPY and RZG), a 40% allocation to Bonds (EDV) and rebalanced quarterly. Presented in the table are the compounded average growth rates for each investment along with its Sharpe Ratio for the period.
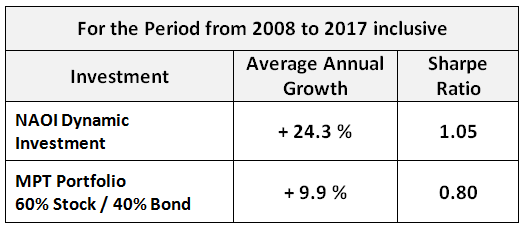
This is not a misprint. The NAOI Dynamic Investment in this example returned over +24% per year during this volatile period, more than doubling that of the MPT portfolio and with lower risk.
How Are Returns Like this Possible?
Most financial professionals, and virtually all market regulators, will proclaim loudly that returns like this are not possible. And they are not possible using MPT portfolio design methods. But DIs are designed using DIT methods, not MPT methods, and the performance barriers erected by MPT are removed. There are many factors that make DIs far more profitable than MPT portfolios. They will be discussed in-depth in a future article in this Series. Here is just one factor:
Time Diversification – DIs use a new risk reduction element that we call Time-Diversification in addition to Company and Asset Diversification. Because DIs automatically signal trades at regularly scheduled Reviews they are time-diversified and thus “market-sensitive”. Not only does this diversification element significantly reduce risk, it also enhances returns as illustrated in the above performance table. In contrast, MPT portfolios are buy-and-hold investments that are not time-diversified and have no sensitivity to market changes. As a result, the value of an MPT portfolio drifts up and down with the tides of the market, unable to capture its full returns potential.
When working outside of the MPT “box” all manner of positive outcomes that we have been taught for decades are impossible, suddenly become probable.
The Mechanics of How Dynamic investments Work
Dynamic Investments use an entirely different approach to investing than do MPT portfolios. Their goal is to take maximum advantage of the positive returns that exist in the market at all times. Let’s look at a DI in action.
The chart below shows how our example DI is able to quickly and objectively change the ETF it holds in an effort to own only equities that are trending up in price. I have shortened the test period here to the years 2007 – 2014 in order to better illustrate the details of how this methodology works in this limited space. This test period includes a major stock market crash in 2008 and an unprecedented stock price run-up from 2009 to 2014.
Detecting and Capturing the Returns of Positive Price Trends
The top portion of the chart shows two price lines for the test period, one for SPY – an ETF that tracks the S&P Stock Index and the other for EDV – an ETF that tracks the price of long-term Treasury Bonds. The horizontal “bar” below the chart shows the asset type owned by the DI at each point along the time-line from 2007 to 2014. Note that the Stock ETF owned was either RZG or SPY as discussed above. The Bond ETF owned was EDV. The vertical, dotted lines indicate when a trade was made.

You can see how the DI quickly rotated between Stocks and Bonds based on the price trends of each asset class in order to capture the gains and avoid the losses of each. And keep in mind that trades were signaled based objective observations of the market, not on subjective human judgments and thus removing a massive risk element.
The DI Performance Table
Below is our DI’s performance chart for this time period. Shown are yearly growth percentages along with the Average Annual Growth and Sharpe Ratio in the final two columns.

You can easily see the advantages of holding this Dynamic Investment over an MPT portfolio that would have simply held both asset types at all times resulting in returns that don’t come close to matching the DI’s performance.
A New Portfolio Performance Benchmark
With the introduction of DIT methods, investors can now use a simple DI, such as the one discussed in this article, as a Performance Benchmark that shows the level of performance being offered by the market at all times. Using this Benchmark, investors can now answer this question: “How effective was my MPT portfolio at capturing the positive returns available in the market for a specified time period?” When looking at the DI Performance Table, just above, most investors will realize that their MPT portfolio was extremely ineffective at capturing market returns potential.
Such a comparison will enable investors to ask another question: “Why should I continue to hold my MPT portfolio when I can hold a simple NAOI Dynamic Investment that is easy to implement / manage and provides higher returns with less risk?” The answer will almost always be: “It is time for change.” And the use of NAOI Dynamic Investments is the change needed.
In an investing world that gives investors a choice between DIT and MPT methods, the investing public will demand higher portfolio returns. Only financial organizations that offer Dynamic Investments will be able to meet this demand.
Next Up: Creating Dynamic, Market-Sensitive Portfolios
DIs can be held by investors as complete portfolio or as one building block of an MPT portfolio. This new designer option will be the catalyst for a significant change in how portfolios are created in the future. The next article in this Series will discuss the advantages of this change and how it works. To be notified when this article is posted, sign up to the NAOI email list on the bottom of the page at this link.

"the future of investing starts here" is a registered service mark of the National association of online investors