
A Quick Overview of Dynamic Investment Theory
and NAOI Dynamic Investments
In 2008 when markets crashed and the MPT portfolios I, Leland Hevner, stopped all NAOI investor education activities. I could no longer teach a portfolio methodology that left students vulnerable to the type of wealth destruction that occurred. At that point I refocused NAOI resources from education to Research and Development in order to find an alternative, or even a replacement, for MPT; one designed specifically to work in 21st century equity markets.
Goals for a New Investing Approach

We began our R&D effort by interviewing individual investors in order to learn what they wanted/needed in a new approach to investing to enable them to enter the equities market with confidence. Fortunately we have access to hundreds of average people with money to invest who are members and/or students of the NAOI. I was determined that any new approach would be designed to meet the needs of the retail investor. Here, in summary, were their goals:
A greatly simplified investing process
Higher portfolio returns with lower risk than MPT portfolios
Absolute protection from market crashes
Absolute protection from Investor abuse, fraud and scams
Less reliance on third parties; i.e. a viable “Do It Yourself” option
We immediately saw that MPT met none of these goals. So we started our search for a better approach to investing with a blank slate; as if MPT had never existed.e is where the text goes.
The Study
From the start, it was obvious to us that the only way to meet the goals set for us by the public was to develop an approach in which trade decisions are made based on observations of empirical market data instead of on subjective human judgments as they are today. We were adamant that in any new approach to investing the competence and honesty of an advisor must not be a variable in how well a portfolio performs.
To meet this design goal we needed to find patterns in historical equity pricing data that had predictive value for future price movements. We found what we were looking for in price trend data.
Significant time spent pouring over historical equity price data showed us that the only thing we can know about market behavior with any degree of confidence is that the prices of asset classes and markets are cyclical and that different asset types and different market segments move up and down at different times as illustrated below.

This observation led us to the premise that at all times and in all economic conditions, there exists somewhere in the market uptrending prices and thus positive returns potential. Our task then became to build an investment type that could detect these areas and capture these positive returns while avoiding areas of the market that were trending down in price. Following a multi-year research effort, we met this goal with the creation of NAOI Dynamic Investments.
Introducing NAOI Dynamic Investments
NAOI Dynamic Investments (DIs) are a new derivative investment type that are capable of automatically changing the equities (either ETFs or Mutual Funds) they hold based on a periodic sampling of market trends. The main components of all DIs are shown in the diagram below with ETFs being the equity used in the example. Each component is explained below the diagram:

Dynamic Equity Pool (DEP) – This is where the DI designer places multiple ETFs that track areas of the market where the DI will search for price uptrends and positive returns. These are DI purchase candidates. Only the one ETF having the strongest upward price trend at a Review event is purchased and held for one “Period” until the next Review event as discussed next.
Review Period – This is how often the DEP will be “ranked” to find the ETF in it that is trending up most strongly in price – “quarterly” is an example. The top ranked ETF is purchased (or retained if already owned) and held until the next Review event (i.e. for one Period).
Trend Indicator – This is the indicator that is used to rank the ETFs in the DEP at a Review event. The NAOI has found a simple indicator that works exceptionally well. It will be shared with organizations that work with the NAOI.
Trailing Stop Loss (TSL) Order – The value of the DI is protected at all times with a TSL Order
DIs are active investments that are passively managed. Investors simply buy and hold them while the DI’s internal intelligence signals trades, at predefined, periodic intervals, based on objective observations of market data and not on subjective human judgments that inject a major risk element into the investing process.
MPT / DIT Performance Comparison
To determine if DIs met the goal of providing higher returns and less risk than MPT portfolios, NAOI researchers performed a series of tests, a subset of which is described below.
The MPT Benchmark
We first established a MPT portfolio benchmark performance level against which we could compare the performance of various DI designs. For this purpose we used the simplest MPT portfolio possible, one that contained a Stock component with 60% allocation and a Bond component with 40% allocation and rebalanced quarterly. We used these ETFs to represent each asset class:
SPY – SPDR ETF tracking the S&P 500 Index – LargeCap Value Stocks
BND - Vanguard Total Bond Market ETF
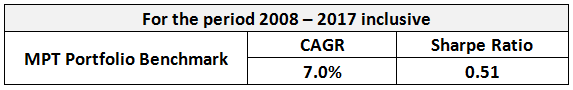
We defined “performance” as being the combination of an investment’s Compounded Average Growth Rate (CAGR) and a risk measure called the Sharpe Ratio that shows how much return was achieved for each unit of risk taken – the higher the better. We used a backtest period from the start of 2008 to the end of 2017, a period that included both a major stock market crash and an unprecedented bull market run.
The MPT Benchmark Performance
Using MPT methods, the two ETFs used were simply bought and held for the entire period with quarterly rebalancing to maintain the original allocations. Here was our MPT benchmark performance:
Test Dynamic Investments and Performance
Next we tested the performance of three Dynamic Investment designs during the same time period using identical performance measures and compared each with the MPT Benchmark performance shown above. Here are the ETFs we used in the DI test process in addition to SPY and BND:
EDV - Vanguard Extended Duration Treasury ETF
RZG - Invesco S&P SmallCap 600 Pure Growth ETF
RPV - Invesco S&P 500 Pure Value ETF
The table below shows the performance for each of our DI test investments. The DIs tested are described below the table.
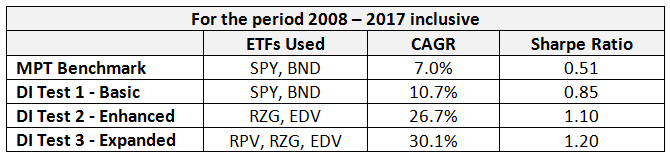
Test Dynamic Investments
The top row of the table shows the MPT benchmark performance. The bottom three rows show the performance of each DI we tested as described below.
DI Test 1: Basic DI – For our first DI test we placed in its DEP the same ETFs used in the MPT Benchmark Portfolio for an “apples-to-apples” comparison. The results showed us that by changing only the investing approach used from MPT to DIT higher returns with lower risk could be produced. But the performance increase was not earth-shaking, and certainly not enough to prompt a change in the fundamental way we invest.
DI Test 2 – Enhanced DI – In this test, we retained both a Stock and Bond component in the DI’s DEP but changed the ETFs for each to ones that track more volatile areas of the asset classes. Now we saw significant performance increase and learned that we could increase performance by working with different “types” of each asset class. In this case we replaced relatively conservative stock/bond ETFs with more volatile ETFs that had higher upside potential. The greater downside risk was mitigated by the DI design structure and management process.
DI Test 3 – Expanded Reach DI – For our third test we added another stock “type” ETF to the DEP used in Test 2. This expanded the area of the market where this DI could look for price uptrends. The amazing performance of the Test 3 DI showed that we could increase performance by adding ETFs to the DEP.
As a result of this, and other, testing we concluded that NAOI Dynamic Investments met the goals of providing higher returns with lower risk in a very simple, objective and logical manner. Some amount of knowledge and effort is needed to find an optimal combination of ETFs in the Dynamic Equity Pool but this is relatively easy research using the tools and knowledge that the NAOI can provide.
Higher Returns without Higher Risk!
The fact that higher returns can be achieved by means other than exposure to higher risk (note in the performance table that the Sharpe Ratio goes up in lockstep with the returns) is massively significant in the world of investing. In fact, MPT is based on the assumption that the only way to get higher returns is to assume higher risk. If this isn’t true, then the MPT approach crumbles; and with the introduction of NAOI Dynamic Investments, it just did.
How Is Performance Like this Possible?
Financial mavens today will say that returns like those shown above are impossible. And they ARE impossible using MPT methods. But we are now working with DIT investing methods and the old rules and limitations no longer apply. Below are just a few of the reasons why these returns are possible:

DIT uses a new diversity element that we call “Time-Diversity”. It arises from the fact that DIs periodically sample the price trends of the equities in its DEP and signal a trade if the ETF currently held is not trending up in price the strongest. Time-Diversity not only reduces risk but also enhances returns. Of course MPT, buy-and-hold portfolios do not use this valuable diversity element.
By design, MPT portfolios hold uptrending AND down-trending equities at all times to reduce risk. DIs strive to hold only uptrending equities at all times. Risk is reduced by other elements of the DI design and management process; and reduced more effectively.
DI trade decisions are based on objective observation of market trend data that has been proven to be predictive of future price movements. This removes the need for subjective human judgments and the devastating risk factors that they inject into the investing process.
In summary, DIs are able to outperform MPT portfolios by a significant margin because they are dynamic and market-sensitive while MPT portfolios are static and blind to market movements. When the MPT “blinders” come off, the door to a new world of higher investing performance is opened wide.
A Boon for the Financial Industry
Dynamic Investment Theory and NAOI Dynamic Investments were created to meet the needs of the retail investor. But their introduction will also be a massive boon for the financial industry. Here are just a few reasons why:

The simplicity, high-returns and low-risk features of Dynamic Investments will bring millions of new clients into the market who are currently sitting on the market sidelines in fear of how investing works today. DIs erase most of these fears; foremost among them the absolute protection of portfolio value from market crashes via the use of Trailing Stop Loss orders.
DIT opens a massive new field of relatively easy product development. Whereas the creation of new ETFs and Mutual Funds is expensive, complex and time consuming, DIs are created by simply combining existing ETFs or Funds in the DIT-defined structure. As a result, entire new DI product lines can be developed virtually overnight by those who are trained by the NAOI to do so.
DIs can also be used as building blocks in a more traditional MPT portfolio structure, making the transition from MPT to DIT minimally disruptive to current operations. The NAOI has created multiple easy transition plans that are completely under the control of the financial organization using them. DIT is not an all-or-nothing proposition.
Financial organizations that place Dynamic Investments and DIT methods in their strategic planning process NOW will be prepared to gain a massive competitive advantage in a DIT-based future of investing that is coming fast.
The Evolution of Investing Is Inevitable
Make no mistake, DIT is not a minor “tweak” to the way we invest today in the same manner as are developments such as robo-advisors or smart-beta ETFs. DIT and DIs represent a totally new concept of investing that will finally provide a viable alternative to rapidly aging MPT methods.

Before the release of DIT, the public was told that using MPT methods was the only way to invest. With the introduction of DIT, now there are two viable investing approaches. And there are actually three if we include a methodology that combines the best aspects of both MPT and DIT in what we call Hybrid Portfolios.
When the public learns about the benefits of DIs - a goal of the NAOI and our education partners - they will demand them from the financial services industry. If a current advisor doesn’t offer them, clients will move to others that do. If they can find none that offer DIs, individuals will easily be able to implement NAOI created DIs, such as the Test 3 DI discussed above, on their own using an online broker. When one financial organization offers DIs and begins attracting clients, change will no longer be an option for financial service organizations who want to “stay in the game”.
Choices and competition between these choices are the fuel that will power investing to evolve to a simpler, friendlier and more profitable place for both individual investors and the financial services industry. Financial organizations that embrace DIT and NAOI Dynamic Investments will thrive in the future of investing. Those that don’t will fade away. That’s just how evolution works.
More information is found at naoi.org.

"the future of investing starts here" is a registered service mark of the National association of online investors