
This Web page presents a Dynamic Investment (DI) "cheat sheet" that gives readers a quick introduction to this revolutionary investment type. This is a new investment type in the world of investing that has the potential to outsell both ETFs and mutual funds in an investor portfolio. A more detailed description of DIs is found at this page.
The Dynamic Investment Components

The Dynamic Investment structure is remarkably simple and effective. A DI is a derivative investment vehicle that combines Exchange Traded Funds (ETFs) – or Mutual Funds - in an intelligent, dynamic structure. It has three design elements as shown in the nearby diagram. The Dynamic ETF Pool is where designers place ETFs that track the asset classes and/or market areas where they want the DI to search for positive price trends. The other two variables are a very simple Trend Indicator and a Review Period.
At periodic Review events, typically occurring quarterly, the DI uses the Trend Indicator to rank the ETFs in the DI’s pool of potential purchase candidates. Only the ETFs with the strongest upward price trend are bought and held until the next Review event when the process is repeated. Thus, all trade decisions are made based on objective observations of easy to find market data and not on risk-laden subjective human judgments or complex computer algorithms. DIs were designed to be so simple that individuals of virtually all experience levels can implement and manage them on their own, if they wish, using an online broker.
How DIs Capture Market Gains
The following series of charts and a table illustrate how Dynamic Investments work and how they performed during the volatile market period from the start of 2007 to August of 2018 when these words were written.
Stock / Bond Performance 2007 - 2018
The first chart, just below, shows the value growth of a total market Stock ETF and a total market Bond ETF during the test period. Just below the chart is a bar that shows which of these two assets the simple NAOI "Primary" DI selected and held during this period. This is the simplest DI possible that only rotates between Stocks and Bonds based on the price trends of each. Keep in mind that all DI trade signals were generated automatically by the DI based on a periodic observation of market trend data; no human subjective decisions were involved.

You can see that the NAOI designed DI was able to automatically detect uptrends in both Stocks and Bonds and change the ETF it held to take advantage of them while avoiding the losses of downtrends. DIs are market-sensitive while MPT portfolios are not and the difference in performance is astounding as discussed next.
The Primary DI Value Growth 2007-2018
So, how did this simple DI perform? The chart just below illustrates that it performed extremely well. It shows the value growth of the DI during the test period. For comparison purposes, it also shows, at the bottom of the chart, the value growth of an industry standard MPT portfolio with a 60% allocation to Stocks and a 40% allocation to Bonds. You can see that the DI increased in value during this period by 1765% while the MPT portfolio increased by only 91%. And, again, keep in mind that this performance was achieved based on the use of objective data, not on subjective human judgments that would inject a massive risk element into the process!

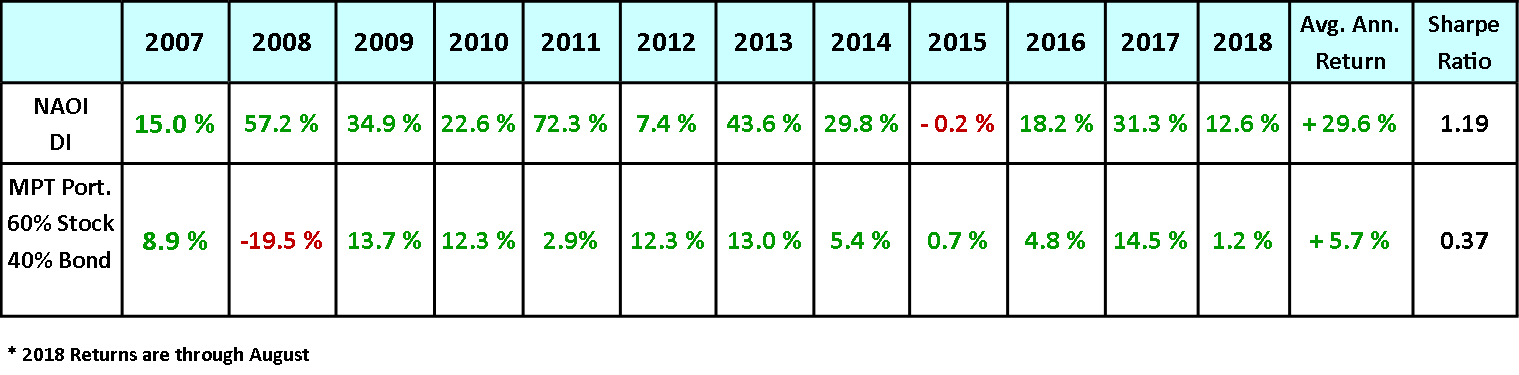
Primary DI Returns 2007-2018
Now let's transform the data in the above chart to return and risk numbers. The table below shows the annual returns for both the DI and the MPT portfolio along with the Average Annual Return and Sharpe Ratio for each. The Sharpe Ratio measures the amount of risk received for each unit of risk taken, the higher the better. And any value greater than 1.0 indicates a superior investment.
Today's financial experts will say that returns like those produced by the DI are impossible. And they ARE impossible using MPT methods. But once the constraints of MPT are lifted, returns are allowed to soar without increased risk.
How Are Returns Like This Possible?
To explain how DIs produce such exceptional returns let's think about the differences between DIs and MPT portfolios. Here are three of the most important:
- A DI strives to hold ONLY ETFs (or mutual funds) that are moving up in price at time of purchase. MPT portfolios are designed to hold both winning and losing investments at all times, thus severely limiting their returns.
- DIs are capable of changing the ETF they hold based on a periodic sampling of market trends. MPT portfolios are static and blind to market movements.
- DI trades are made based on objective observations of market data while MPT portfolios only change based on human judgments that inject a massive risk element into the trade decision process.
When DIT methods replace MPT methods, investing outcomes that are seen today as impossible suddenly become probable.
For Immediate Updates
Consider signing-up for NAOI Email Updates at the bottom of this page to be alerted when Dynamic Investment developments occur.

"the future of investing starts here" is a registered service market of Leland Hevner and the national association of online investors